A drug (hormone, poison, etc.) binds to a receptor inside the organism to exert its biological activity. As a consequence, one might expect the dose-response curve to strictly follow the drug-receptor binding curve, i.e. a rectangular hyperbola with C50 = Kd.
Indeed if the reversible dissociation reaction is schematized as:
Kd = [R] [D] / [R-D]
Y = [R-D] / ([R-D] + [R]) = [D] / (Kd + [D])
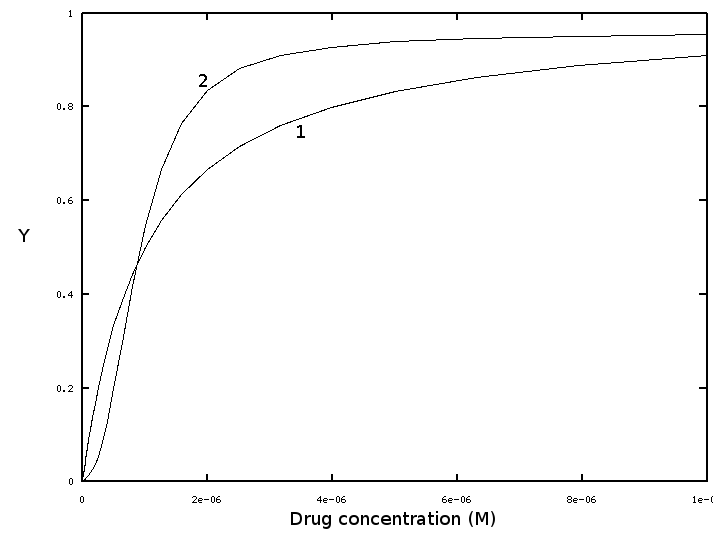
It is quite typical for many biological systems that the dose-response curve of a drug is sigmoidal, rather than hyperbolic. The figure below reports the hyperbolic binding curve of the isolated receptor (curve 1), and the sigmoidal binding curve of the biological effect (curve 2), both as functions of the drug concentration (in the body fluids or in the medium):

The dose-effect curve seems to be cooperative, at variance with the binding curve of the receptor. How can we explain this result? Some years ago I was challenged with a similar problem by Prof. Donato Cioli, a very respected scientist working on the human parasite Schistosoma mansoni. Apparently the drug Praziquantel kills schistosomes with a sigmoidal dose-effect curve. The receptor of the drug being not known, Prof. Cioli asked me whether it was reasonable to assume it to bind the drug cooperatively. Although in that case cooperative binding of the drug could not be directly excluded, it is not a likely explanation of the observed dose-response curve, since it would imply that the receptor is multimeric and cooperative with respect to its exogenous ligand.
A simpler explanation of the sigmoidal dose-response curve of many drugs is as follows: (i) the drug reversibly bind its receptor with a simple hyperbolic behaviour, fully consistent with the mass law. (ii) The biological effect is not a linear function of the fraction of bound receptors: it is indeed quite likely that the organism withstands the blockade of a small fraction of receptors without symptoms (i.e., in our example, the schistosome can survive in spite of a small fraction of the drug receptors bound to the drug); thus a drug concentration that yields a small value of Y has no effect. By contrast maximal biological effect can be achieved before 100% of the receptors are bound (i.e. it is unlikely that any worm can survive if the majority of, even though not all, the receptors are bound to the drug).
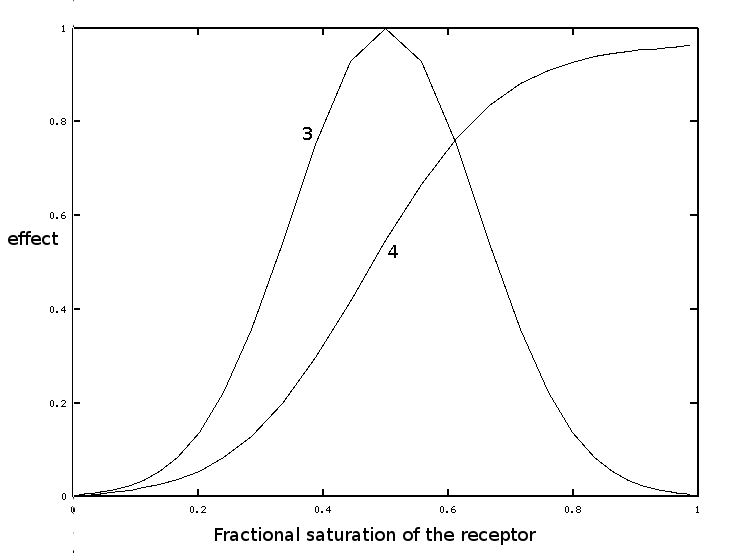
If we make the quite reasonable assumption that the biological effect (in our example the mortality of the parasite) is a gaussian function of the fraction of the receptor bound to the drug, we obtain:

If the cumulated biological effect (curve 4) is plotted versus the dose of the drug, rather than the fractional saturation, one obtains curve 2, i.e. the sigmoidal dependence of the biological effect on the concentration of the drug.
All the curves in this exercise were calculated and normalized to fit the same 0-1 scale - no actual experiment is shown. Parameters are: Kd of the receptor 1e-6 M; Gaussian was constructed using Y=0.5 as midpoint and sigma=0.15.
Home page