|
analysis of kinetics and inhibition of a two-substrate enzyme, and some hints to avoid common pitfalls Andrea Bellelli Department of Biochemical Sciences “A. Rossi Fanelli”, Sapienza University of Rome, Italy A lecture given at the annual meeting of PhD students in Biochemistry, Brallo di Pregola (PV) 2015. Abstract Thioredoxin Reductase (TR) is an important, ubiquitary enzyme, whose physiological function is the reduction of the two-Cys protein thioredoxin, using NADPH as the electron donor. The reaction catalyzed by TR is as follows: Given the fundamental biological functions of thioredoxin, TR is an attractive pharmachological target, and its inhibition has proven or proposed relevance for the treatment of inflammation, cancer, parasitoses and other diseases. We recently published the structure, kinetics and inhibition properties of TR from the malaria parasite Plasmodium falciparum, and the related enzyme Thioredoxin Glutathione Reductase from the parasite Schistosoma mansoni. In the courses of these studies we realized that the studies of TR inhibitors present in the literature contain conflicting data, often within the same study, and decided to analyze the problem and to propose a revision, if possible. The two most relevant causes of the observed discrepancies and inconsistencies are: (i) acritical use of equations developed for single substrate enzymes in the analysis of data obtained on two-substrate enzymes; (ii) insufficient discrimination of reversible and slowly-binding irreversible inhibitors. Selected references by the author Saccoccia F, Angelucci F, Boumis G, Carotti D, Desiato G, Miele AE, Bellelli A (2014) Thioredoxin reductase and its inhibitors. Curr. Protein Pept. Sci. 15: 621-646. Boumis G, Giardina G, Angelucci F, Bellelli A, Brunori M, Dimastrogiovanni D, Saccoccia F, Miele AE. (2012) Crystal structure of Plasmodium falciparum thioredoxin reductase, a validated drug target. Biochem Biophys Res Commun. 425: 806-811. Saccoccia F, Angelucci F, Boumis G, Brunori M, Miele AE, Williams DL, Bellelli A. (2012) On the mechanism and rate of gold incorporation into thiol-dependent flavoreductases. J. Inorg. Biochem. 108: 105-111. Angelucci F, Dimastrogiovanni D, Boumis G, Brunori M, Miele AE, Saccoccia F, Bellelli A. (2010) Mapping the catalytic cycle of Schistosoma mansoni thioredoxin glutathione reductase by X-ray crystallography. J Biol Chem. 285: 32557-67. Thioredoxin Reductase as an example of a two-substrate enzyme TR has quite a complex structure, since it is an obligate homodimeric enzyme made up by two identical subunit, each containing a FAD and a Selenocysteine residue (Sec). The internal electron flow is correspondingly complex, since each subunit can reversibly bind one molecule of NADPH, whose electrons are transferred to the FAD, then to a Cys couple and finally to a Sec-Cys couple located on the C-terminal arm of the partner subunit (hence the necessity of the homodimeric structure), which in turn is responsible for the reduction of thioredoxin (Trx). This mechanism is obviously too complex to be directly employed to analyze stationary state experiments: some simplification is required; however one cannot exceed in simplificating the analysis. 1. A simplified steady-state kinetic model for Thioredoxin Reductase. Most oxidoreductases are two-substrate enzymes whose catalytic cycle can be simulated by considering a reductive and an oxidative half cycles. TR is no exception to this rule, and a simplified kinetic scheme is as follows:
Since the reaction is driven by the large difference in the redox potential between NADPH and the Cys couple in Trx, we can safely assume that the reactions involving electron transfer are irreversibe. Moreover, given that the two substrates bind to different sites, but Trxox is ineffective if bount to TRox and NADPH is ineffective if bound to TRred, we can neglect the complexes TRoxTrxox (which we expect to behave as TRox) and TRredNADPH (which we expect to behave as TRred). In order to derive the rate of substrate transformation we adopt the pseudo-equilibrium approximation and define: We should also take into account that under steady state conditions the rates of oxidation and reduction must be equal, i.e.: From the above equations we can derive the binding polynomial of TR, i.e. an expression in which the concentration of one species is taken as a reference and those of all other species are expressed as functions of the reference species, the equilibrium and kinetic constants and the concentrations of the two substrates. Any form of the enzyme can be used as the reference species and in the following treatment we shall use as the reference species TRox. Fr the sake of simplicity we shall use the term "N" to stand for the molar concentration of NADPH (i.e. N = [NADPH]) and "S" for the molar concentration of Trxox. Thus we obtain:
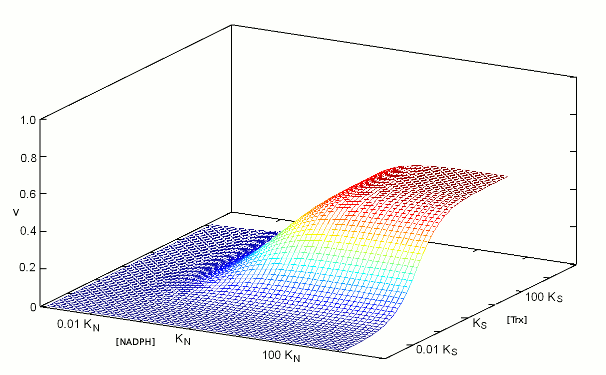
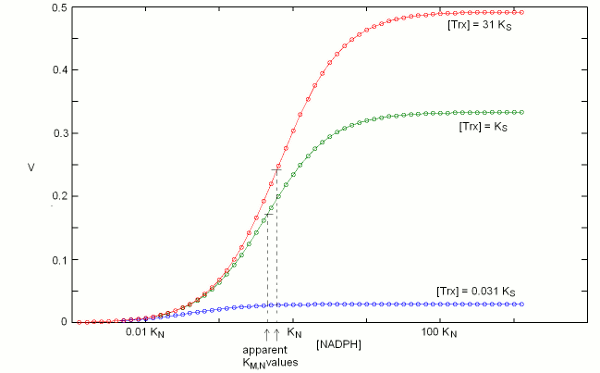
We construct the binding polynomial of TR, i.e. the sum of all species of the enzyme espressed as a function of the concentration of the reference species: It is important to keep track of the meaning of each term: [TRox] KNkoxS / KNkoxS = [TRox] is the concentration of the reference species; [TRox] NkoxS / KNkoxS is the concentration of species TRoxNADPH; [TRox] NkredS / KNkoxS is the concentration of species TRredTrxox; and [TRox] NkredKS] / KNkoxS is the concentration of species TRred. We can now define the rate of substrate transformation, which in the usual enzyme assay is measured by the absorbance change associated to NADPH oxidation: where the term N S kox / (KNkoxS + NkoxS + NkredS + NkredKS]) represents the fraction of the total enzyme in the form of the TRoxNADPH complex. We remark that the equation describing the rate of substrate transformation is directly proportional to the concentration of both substrates, and to the value of both kinetic constants, as one may have expected. We also remark that this function can be applied as such, for any data set, provided that the concentration of both substrates have been systematically explored. Obviously, V is a function of two independent variables and the pertinent graph is three-dimensional:  The figure above represents the rate of NADPH oxidation as a function of the logarithms of the concentrations of both substrates, varied over a 6 orders of magnitude interval centered on the respective dissociation constant (i.e. [NADPH] varied between KN / 1000 and 1000 KN; and the same applies to [Trxox]); both the reduction and the oxidation rate constants were assumed equal to 1/s, for simplicity. It will be noticed that the maximum attainable rate of NADPH oxidation, at saturating concentrations of both substrates equals the ratio kox kred / (kox + kred) that in this example equals 0.5/s. 2. Isn't there a more conventional plot for two-substrate enzymes? Enzymologists are often more familiar with the classical Michaelis and Menten representation of steady state experiments (or with its linearization, using the Lineweaver and Burk plot), and when publishing a paper one is often encouraged to use these representations rather than the three-dimensional plot depicted in the above paragraph. The simple recipe to obtain a more classical plot is to systematically vary the concentration of one substrate while keeping fixed that of the other: in this way a typical hyperbolic plot can be obtained, from which two parameters formally analogous to KM and kcat can be obtained; and by inverting the fixed and varied substrate, one obtains steady state parameters for both. The procedure described above is widely applied, but its implications are often neglected. Suppose that we apply the procedure to TR, and that we keep [Trxox], while systematically varying [NADPH]. We obtain a hyperbola whose asymptote, (Vmax/Etot = kcat,N,app) at saturating concentration of [NADPH] can be estimated by increasing the term N to infinity, removing from the rate equation any term that does not contain N and then simplifying what is left: We observe that (i) kcat,N,app is a complex function of both kinetic constants (kox and kred), KS and S; (ii) kcat,N,app cannot be considered a "constant" or a "parameter" since its contains the concentration of the fixed substrate S. We may now turn to the other parameter, namely KM,N,app, which is defined as the concentration of the variable substrate required to achieve half the maximal rate: = 2 KM,N,app S kox kred / (KNkoxS + KM,N,appkoxS + KM,N,appkredS + KM,N,appkredKS) After the obvious simplifications, we obtain: and We again observe that KM,N,app is not a "parameter" since it is a convolution of four constants and one variable; however, KM,N,app is directly proportional to KN, the real thermodynamic parameter of our kinetic scheme. It is remarkable that our two apparent parameters bear the same relationship with the corresponding intrinsic parameter: indeed if we define the term L = koxS / (koxS + kredS + kredKS), it is evident that: KM,N,app = L KN The figure below reports three curves selected from the data used in the preceding Fig.1 to demonstrate that the apparent parameters kcat,N,app and KM,N,app both depend on the concentration of the fixed substrate S=[Trxox].  Notice that [N] is reported on a logarithmic scale. 3. So what? The above discussion makes clear that one can indeed obtain plausible hyperbola for a two-substrate enzyme by keeping the concentration of one substrate fixed while systematically varying the other; however the parameters one obtains are complex convolutions of the desired ones, that also include the concentration of the fixed substrate. By no means these apparent KMs and kcats can be considered analogous to the corresponding Michaelis parameters for single-substrate enzymes, nor can they be compared with similar parameters obtained on related enzymes or on the same enzyme but at a different concentration of the fixed substrate. Although in principle one can measure apparent values of kcat,N,app and KM,N,app at several concentrations of the fixed substrate (Trx) and use the whole set to calculate the four intrinsic parameters of the model (KN, kred, KS, and kox) this procedure would be experimentally as demanding as the one required to collect all the data depicted in Fig.1 and the analysis would be statistically unsound. The best procedure is to collect the data and to analyze them globally using eq.3; then, if required one may represent the data as families of Michaelis hyperbola, as in Fig.2. Unfortunately, even the soundest statistical analysis is model dependent, and a kinetic scheme different from eqs. 1 and 2 would yield a kinetic equation different from eq.3. We shall not deal with the theory of global data analysis here. We only remark that we need a set of rate values experimentally determined at several values of [Trxox] and [NADPH], that we call Vexp = f(S,N); we then use eq.3 to calculate a corresponding set of Vcalc = f(S,N,KN,kred,KS,kox). We then only have to ask our computer to find the parameter set (KN, kred, KS, and kox) that minimizes the quadratic error function: Σ(Vexp-Vcalc)2. The important take home message thus far is that the apparent KM and kcat parameters for a two-substrate enzyme, calculated by reducing the steady state plots to Michaelis hyperbola, are apparent parameters, remotely related to the actual thermodynamic parameters, and dependent on the concentration of the fixed substrate. Thus they should neither be used nor published. At a superficial reading this type of error usually escapes detection: after all if one publishes apparent KM and kcat values for both substrates, he is providing four parameters, exactly the same number as that of the actual parameters of the simplified model (eqs.1 and 2). When an inhibitor enters the picture, as it often happens, however, the error becomes evident, as we shall demonstrate shortly. 4. Competitive inhibitors of TR Several competitive inhibitors of TR are known. Some of these are molecules which reversibly combine with either the binding site of Trxox or NADPH; others are molecules that after an initial reversible binding form a covalent bond and become irreversibly (or practically irreversibly) bound. In the latter case the inhibitor shifts from competitive to irreversible (hence non-competitive) with time. We shall consider in this lecture only reversible inhibitors (or irreversible ones incubated for too short a time for the irreversible bond to be formed). Reversible inhibitors of TR which compete with NADPH exist: e.g. indomethacin. These are poorly specific and of limited medical interest, thus their characterization has been less extensive than that of inhibitors competing with Trx. A well characterized inhibitor of this type is methylarsonous diiodide, CH3AsI2, an inhibitor that initially binds reversibly to the same site of Trx but on long incubation time under reducing conditions forms a covalent bond with the active site Cys residues. Methylarsonous diiodide is reported to have a KI of 100 nM if its affinity is measured at constant [NADPH] and variable [Trxox], and a KI of 250 nM if the affinity is carried out in the opposite way round, i.e. maintaining a constant concentration of the competing substrate. This is clearly an impossible finding: the same inhibitor cannot have two KIs, depending on the measurement technique. Indeed we may write down the following kinetic model:
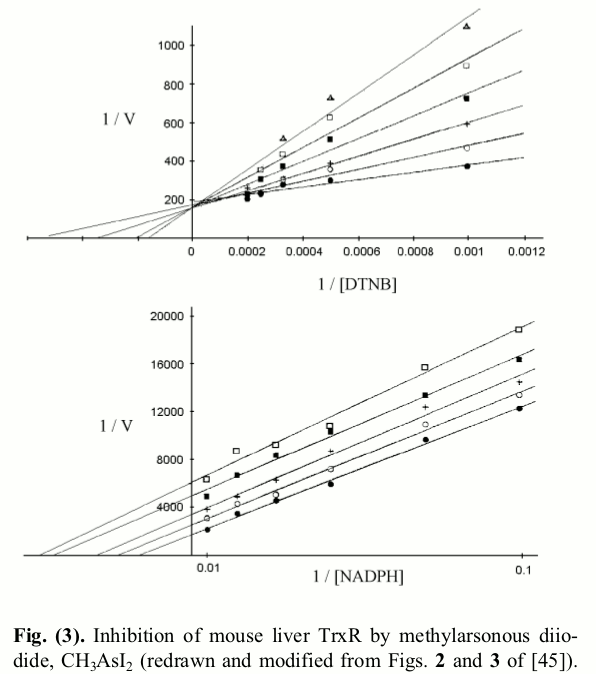
The Lineweaver and Burk plots of rat TR inhibited with methylarsonous diiodide, as redrawn by us (Saccoccia et al. 2014) are reported in the figure below:  As expected, in experiments carried out at fixed concentration of NADPH and variable concentration of the competing artificial substrate DTNB a classical Lineweaver plot of competitive inhibition is obtained, and the straight lines intercept at a common 1/Vmax value, implying that the inhibitor does not change this parameter. This is an important indication, since it confirms actual competition between the inhibitor and the varied substrate (i.e. non covalent binding occurs during the time of the incubation or the assay). By contrast when the same determination is carried out at fixed concentration of DTNB and variable concentration of the non-competing substrate (NADPH), an atypical non competitive inhibition plot is recorded in which the lines run parallel to each other. This finding implies that the inhibitor, besides reducing V and Vmax also reduces the apparent KM for NADPH: i.e. the inhibitor increases the apparent affinity of the enzyme for the non-competing substrate. The authors calculated the values of KI in the two experiments, under the usual assumptions of single-substrate enzymes: i.e. for the upper panel experiment, they assumed KM,N,app = KM,N (1 + [I]/KI); this formula implies linear dependence of KM,N,app on [I] and KI = intercept/slope of the plot KM,N,app vs. [I]. For the lower panel experiment, they used the formula for non competitive inhibition of a single-substrate enzyme: 1/kcat,app = 1/kcat (1 + [I]/KI), which again implies KI = intercept/slope of the linear plot 1/kcat,app vs. [I]. They obtained the two different values of KI for the two experiments and duly reported them in their paper. 5. Can we do better? No matter which experiments one carries out, if the competitive inhibitor obeys a mechanism similar to the one described by eqs. 4 and 5 it has one and only one KI, which may depend on pH and temperature but cannot depend on the substrates' concentrations or on which substrate is varied or kept constant during the experiment. The fact that one finds two KI can be due either to a chemical reaction scheme more complicated that that of eqs. 4 and 5 or to faulty data analysis. Our point is that one cannot use single-substrate analyses for a two-substrate enzyme, and that a clear rationalization of the experimental findings wil be obtained using the appropriate equations. In order to demonstrate this point we derive the rate of NADPH oxidation for the reaction scheme of eqs. 4 and 5 using the method illustrated above, and we obtain: Eq.6 is now a function of three variables, and its parameters can be determined by non linear least squares regression from any extensive set of V=f(S,N,[I]). However, since in the literature data are often analyzed as in Fig.3, we want to analyze what a Michaelis- or Lineweaver- plot in which either substrate is kept constant would look like. If one keeps constant [NADPH], and varies the concentration of the competing substrate Trx at different concentrations of the inhibitor, one obtains a set of Michaelis plots in which: The kcat is obtained, as usual, by increasing S to infinity, by removing all terms that do not contain it, and by simplifying those which are left. We remark that kcat,S,app = kcat,S, consistent with the expectation that at infinite concentration of Trx, I is displaced: the competitive inhibitor is removed form the active site by the competing substrate, thus the kcat of the enzyme is unchanged (see Fig.3, upper panel). By contrast, as expected, the competitive inhibitor changes the apparent KM of the competing substrate, exactly as it occurs in single-substrate enzymes: Thus, the KI value estimated at constant concentration of the non competing substrate, and variable concentration of the competing substrate, using the approximation of the single-substrate enzyme is correct. Explaining the lower panel of Fig.3 is a little more difficult: after all, the data and lines in the upper panel are identical to those one would obtain in the case of competitive inhibition of a single-substrate enzyme, whereas those in the lower panel of the same figure configure quite an atypical case of non-competitive inhibition. We derive from eq.6 the values of kcat,N,app and KM,N,app for experiments carried out at constant S We remark that: (i) the term kcat,N,app is a function of [I] (the non competing substrate cannot displace the inhibitor), i.e. the inhibitor lowers the apparent kcat; (ii) since kcat,N,app < kred, KM,N,app < KN, i.e. the inhibitor increases the apparent affinity of the enzyme for the non-competing substrate. Indeed if we plot 1 / kcat,N,app,I as a function of [I] we obtain: This is the equation of a straight line with slope KS/SkoxKI and intercept 1/kcat,N,app and the ratio intercept/slope does not yield KI (as it would in the case of the single-substrate enzyme); it rather yields: The constant obtained in this way is by no means KI, as it was in the preceding case: it is something that the researcher believes to be KI, but it is actually larger than the true value. Home page |