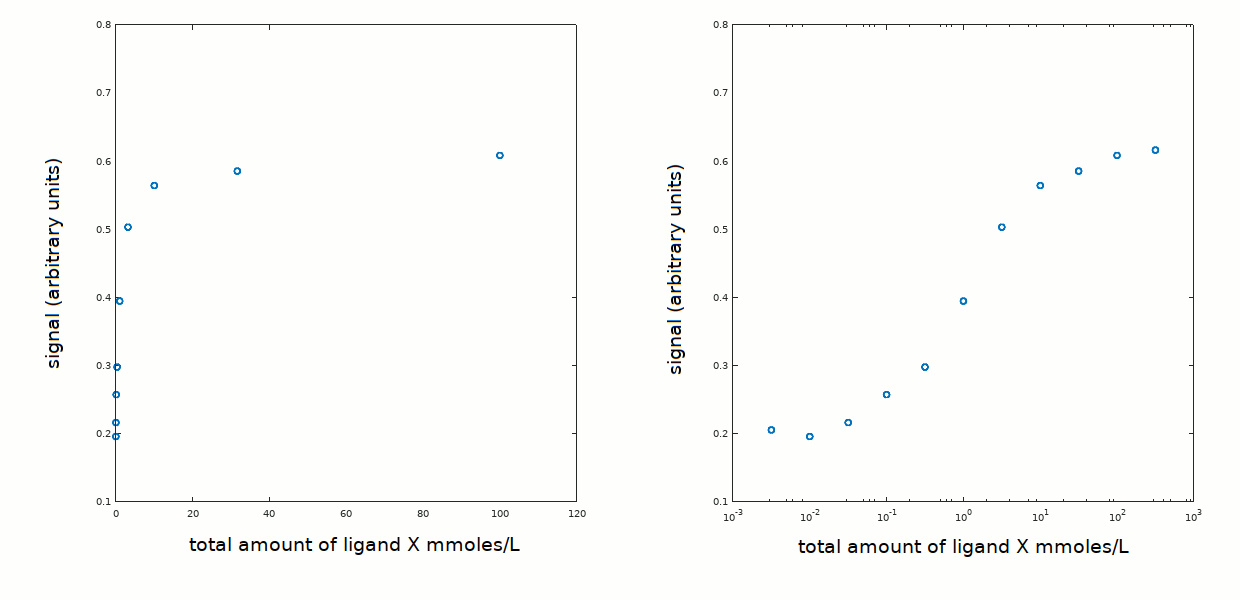
In an experiment aimed at determining the equilibrium constant of the reaction P + X <==> PX, the following data set has been collected:

The protein concentration was 0.05 mM; moreover the protein is pure (by electrophoresis) and is monomeric in solution (by ultracentrifuge or gel filtration chromatography).
The experimental data are plotted below as amplitude of the signal recorded (e.g. the signal may have been absorbance) versus total ligand concentration on a linear scale (left panel) or on a logarithmic scale (right panel). Notice that the ligand concentration required to observe binding is much higher than the protein concentration; this is important because the relationship between [X] in solution (that we call [X]free) and total [X] ([X]tot) is [X]tot = [X]free + [PX].
How would you proceed with data analysis (click to select)?
1) Normalize the signal change in order to extract the fraction of liganded sites
2) Fit eq. for ligand binding directly to the experimental data in order to find the values of Kd and signal amplitude parameters that minimize the sum of the squared residuals.