answer 1-1: normalize signal change
As a general rule this is not the statistically soundest procedure to apply; however, in this case, one has a reasonable number of ponts on both the low and high asymptotes of the signal versus log[X] plot, thus this procedure will yield an acceptable result. We proceed as follows:
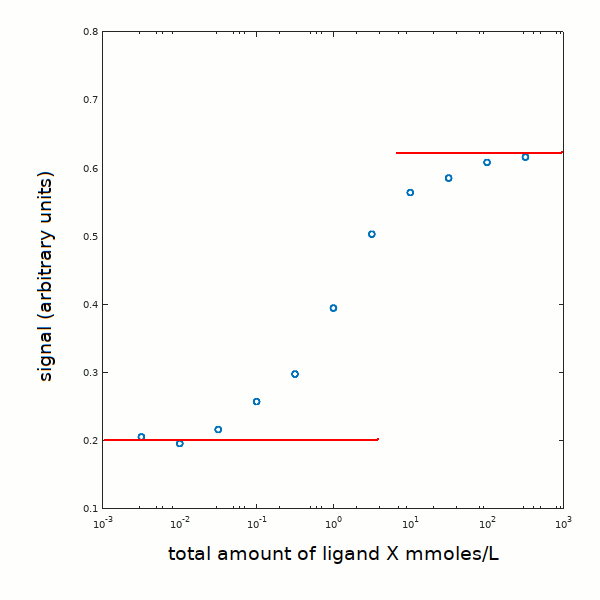
1) we draw orizontal lines corresponding to the asymptotes of the signal change (plotted versus a logarithmic scale of ligand concentration):

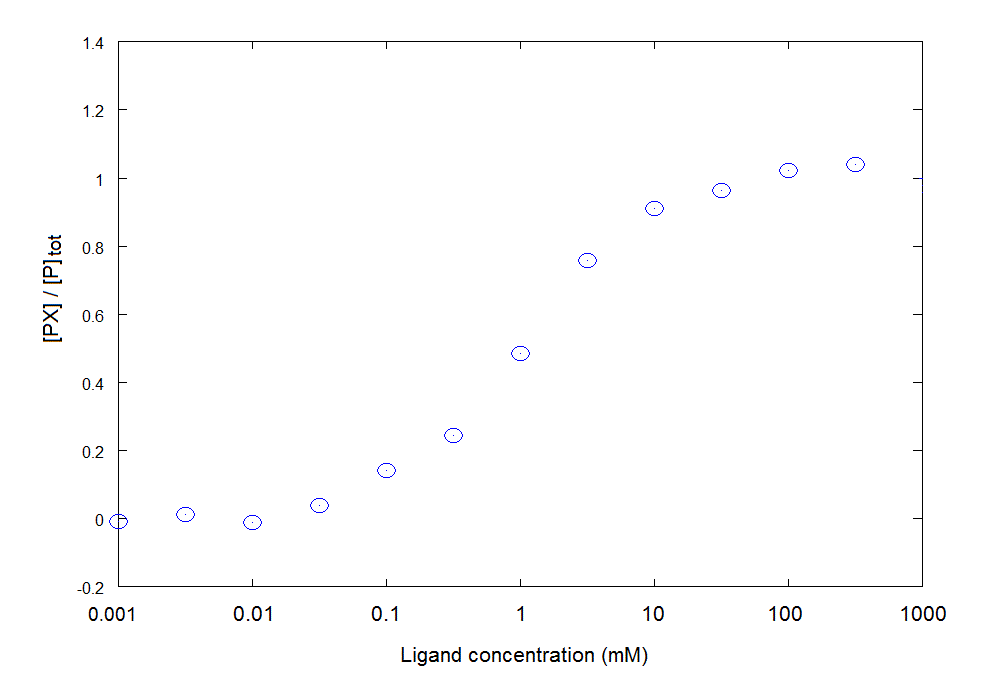
2) We apply to each experimental point the following trasformation: Y = [PX]/[P]tot = (signal - 0.2) / 0.4; moreover, in view of the fact that the protein concentration is much lower than the ligand concentration we may neglect the amount of ligand bound to the protein and equate the total ligand to the concentration of the free ligand in solution. We obtain:

How would you proceed with data analysis (click to select)?
1) Fit eq. Y = [X]/(K+[X]) to the experimental data in order to find the value of K that minimizes the sum of the squared residuals.
2) Linearize the data using Hill's equation log(Y/(1-Y)) = n log([X]) - n log(K) then draw the best straight line through the data points in order to find K and n.
Back one step