answer 1:4 - Hill's plot
The Hill's plot severely distorts the distribution of the experimental error, and is unreliable outside the range 0.1 < Y < 0.9 (or -1 < log Y/(1-Y) < 1). Indeed, depending on the experimental points you select, you may obtain quite different linearizations and quite different values of n and K, as shown in the figure below.
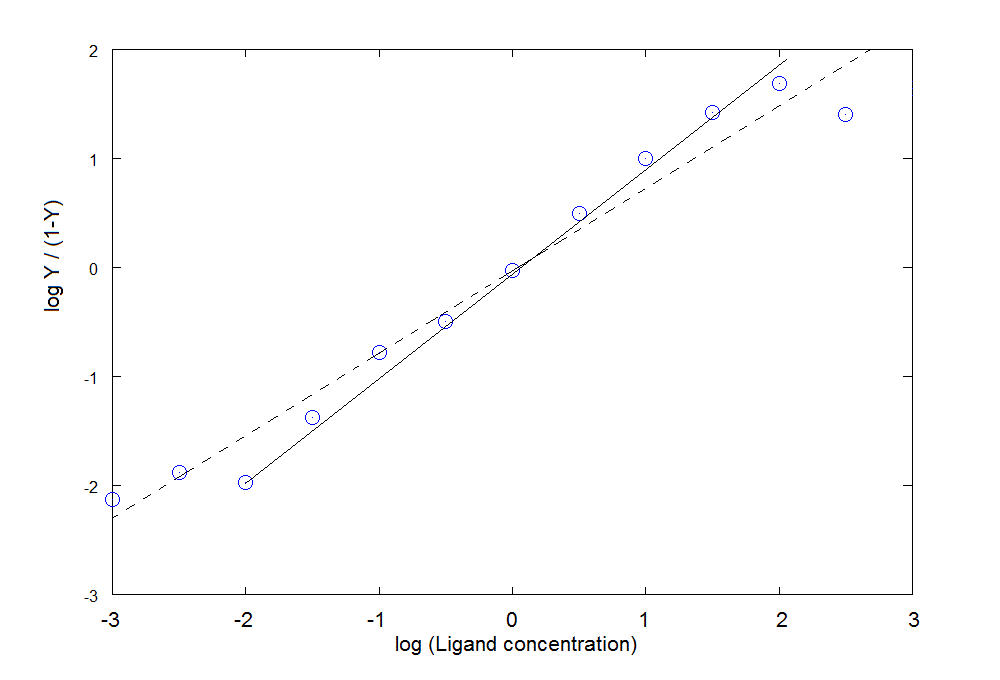
The expected values were n=1 and Kd=1mM. The straight line which excludes the points with log Y/(1-Y) < -1 or > 1 gives a reasonable approximation (continuous line), whereas the straight line which uses all the experimental points (dashed line) is quite off the expected values.
It is suggested that you click on "Back one step" and select a different alternative.
Back one step