Course of LABORATORY MEDICINE
Chemical and Biochemical Methods
ARTERIAL BLOOD
The chosen artery (usual the radial artery at the wrist) is found by palpation and punctured with a gas-tight syringe. The main (only) indication for collection of an arterial blood sample is the analysis of respiratory gases (hemogas analysis), which also gives information on the blood pH and buffers.
VENOUS BLOOD
Venous blood is the standard sample for the majority of clinical analyses. Blood can be separated by centrifugation in a cellular fraction, containing the erythrocytes, leucocytes (granulocytes, lymphocytes and monocytes) and platelets, and a liquid fraction called plasma. If the blood is allowed to clot, the fibrinogen is removed from the plasma: de-fibrinated plasma is called serum.
CAPILLARY BLOOD
So called capillary blood, collected by digital puncture, is used for some analyses (e.g. blood smear, or hemoglobinometry, red cell count), when a venous puncture is unnecessary.
STANDARD CHEMICAL AND PHYSICAL METHODS
Chemical and physical methods are resorted to for the chemico-clinical analyses, whose objective is usually the measurement of the concentration of low molecular weight solutes: ions (electrolythemia); urea; glucose; creatinine; and many others.
POTENTIOMETRIC METHODS. Potentiometric (or electrochemical) methods are safe, rapid and convenient. Since they are based on redox chemical reactions, they can only be applied when the substance one wants to measure undergoes a redox reaction suitable to be used in a galvanic cell. An example is the measurement of most blood electrolytes, e.g. sodium, potassium, calcium, magnesium and chloride. As an example we may redox couple Mg+2 / Mg that undergoes the semireaction:
This semireaction can be made to happen in a galvanic cell containing a solution of a magnesium salt (that dissociates into magnesium ion) and an electrode of elementary magnesium. The solution of magnesium salt, of course, may be any biological fluid (e.g. blood serum). The electric potential of this cell is determined by Nernst's equation:
E' may be measured using a potentiometer, i.e. an instrument that determines the electromotive force of a battery composed by the above cell, and a reference cell of known potential (E"):
From the above equations one derives:
log [Mg+2] = (E' - Eo) n/0.06
Potentiometric methods are strongly selective: if an electrode of Mg is immersed in a sample of blood plasma, that contains dozens of different electrolytes, it will form a redox couple only with Mg+2, ignoring all other ions. They are also very fast: the instruments measures the f.e.m. and calculates [Mg+2] in a matter of seconds or less. Given that the working time of the technician is the most relevant parameter in determining the cost of the analysis, electrochemical methods are also cheap.
There are two limits of electrochemical methods: (i) they cannot be applied to analytes that do not undergo convenient redox reactions or that undergo redox reactions unsuitable to be realized in galvanic cells; and (ii) they require a selective electrode that may not be cheap, easy to build, and durable. These limitations have often be overcame by means of electrodes capable of quantitatively exchanging the ion of interest with another, easier to measure. E.g. the instrument used to measure the pH (pHmeter) uses an electrode that exchanges H+ with K+, and measures the latter in place of the former, in order to avoid the necessity of the idrogen gas electrode.
MANOMETRIC METHODS. Manometric methods rely on the measurement of gas volumes at constant (atmospheric) pressure or of gas pressures at constant volume. Obviously they are ideally suited for respiratory gases: O2>, CO2, N2. They are often coupled with potentiometric methods: e.g. the patient may breathe in a spirometer that measures the volumes of inspired and espired air, and the oxygen content may be determined using an oxygen electrode.
Respiratory gases behave ideally, thus they obey the state law:
P V = n R T
where P is the pressure in atm or mmHg, V the volume in litres, T the temperature in Kelvin, n the number of moles of particles contained in the gas sample and R the gas constant (0.082 L Atm / mol K). The number of moles of a given gas in a given sample results:
n = P V / R T
E.g. if a patient inspires 5 L/min of air at 1 atm and 25 C (298 K) with an O2 content of 20% and expires an equal volume of air at the same pressure and temperature with O2 content of 15%, he has:
inspired nO2, insp = 1 x 5 x 0.2 / 0.082 x 298 = 0.041 moles O2
expired nO2, exp = 1 x 5 x 0.15 / 0.082 x 298 = 0.031 moles O2
the amount of oxygen retained (and used) by the organism in one minute is thus 0.041-0.031 = 0.010 moles.
OSMOMETRY AND OTHER METHODS BASED ON COLLIGATIVE PROPERTIES. These methods are employed only in a limited range of analyses, e.g. the osmolarity of urine may be measured as a gross test of renal function. Measuring the true osmotic pressure of a solution by means of an osmotic balance usisng the appropriate semipermeable membrane is expensive, thus the density of the sample or its freezing temperature are measured instead.
SPECTROPHOTOMETRIC METHODS. Spectrophotometric methods take advantage of the interaction with radiant energy to determine the qualitative and quantitative composition of matter. Given that the interaction between radiant energy and matter causes different effects depending on the wavelength, there are several different kinds of spectrophotometric methods.
ABSORPTION SPECTROSCOPY IN THE UV/Vis WAVELENGTH RANGE. The most widely employed spectroscopy technique relies on the absorption of light in the visible and Ultra-Violet regions of the spectrum. This region of the spectrum corresponds to a wavelength range of 650-200 nm.
A photon of this wavelength has energy enough to promote the bonding electrons of a molecule fom their ground state to an excited state: typically absorption of one photon excites one electron of a π bonding orbital to the corresponding π* antibonding orbital. Decay of the excited state to the ground state may occur radiatively (i.e. with emission of light, in phenomena called either fluorescence or phosphorescence) or non radiatively (i.e. with emission of heat). Other electronic transitions are possible in specific (less common) chromophores: e.g. in hemoproteins a d --> π* transition can be excited, promoting one electron residing in a d orbital of the iron to a π* orbital of the porphyrin. A substance which has absorption in the UV/Vis range is called a chromophore and appears colored to the eye, if it absorbs in the visible range of the spectrum.
The instrument required for a measurement of absorption spectrophotometry can be represented as in this scheme:
T = intensity of transmitted light / intensity of incident light
Since in this type of spectroscopy the sample can only absorb light, it is evident that 0 < T < 1 : i.e. the sample cannot transmit more light than it receives nor can it transmit less than zero.
Absorbance (also named Optical Density) is defined as:
Abs = -log10 T
Absorption spectroscopy obeys the Lambert and Beer's law:
Abs = ε C l
where ε represents the extinction coefficient of the chromophore at the wavelength used in the experiment, C its molar concentration and l the length of the optical path (usually 1 cm). A consequence of this law is that the concentration of a chromophore can be determined as:
C = Abs / ε l
By varying the wavelength of the incident light, one can collect the absorption spectrum of the sample, the Cartesian graph of Absorbance vs. wavelength, as in the absorbance spectra of oxy- and deoxy-hemoglobin, below:

An important feature of absorption spectra is their nearly-Gaussian shape: i.e. the light required to promote the electronic transition(s) is not strictly monochromatic. This dependes on the energetic degeneracy of the ground and excited states of the chromophores. In the absence of degeneration (e.g. in atomic spectra) the absorption bands reduce to pure monochromatic lines.
Absorbance is a very useful and inexpensive method for determinining the concentration of a substance that has significant values of ε at any wavelength in the 650-200 nm range. Unfortunately not all substances have significant extinction coefficients in this spectral regions; moreover biological samples usually contain mixtures of different substances and it may happen that the chromophore whose concentration we want to measure is mixed with other interfering chromophores which absorb in the same spectral range. The absorption of a mixture of different chromophores with overlapping extinction coefficients is:
Abs = (ε1 C1 + ε2 C2 + ε3 C3 + ...) l
Resolving the concentration of each chromophore (C1, C2, C3, ...) can be done by comparison of the absorbance values at different wavelengths, given that the extinction coefficients of each chromophore vary; but this is usually not an easy task. A very convenient method to overcome the problem of interference is to take advantage of a chemical reaction specific of the chromophore that we want to measure, that abolished its absorption: e.g. if our chromophore absorbs light because of a π --> π* transition and if a reaction exists that saturates the double bond and breaks the π orbital, we can measure:
Absbefore reaction = (ε1 C1 + ε2 C2 + ε3 C3 + ...) l
Absafter reaction = (ε2 C2 + ε3 C3 + ...) l
Absbefore reaction - Absafter reaction = ε1 C1 l
C1 = (Absbefore reaction - Absafter reaction) / ε1 l
FLUORESCENCE SPECTROSCOPY IN THE UV/Vis WAVELENGTH RANGE. While most organic compounds absorb light (though often in regions of the spectrum that are poorly convenient in practice), only a few of them are fluorescent. Once an organic molecule has absorbed light and one of its electrons has been promoted from the ground to the excited state (most often in a π --> π* transition) it usually reverts to the ground state with emission of heat. Fluorescence is an uncommon consequence of absorption and consists in the emission of light during the process of de-excitation from the excited to the ground state: π* --> π + light. The wavelength of the light emitted by the excited sample is usually longer than that of the absorbed light (i.e. the emitted light has less energy per photon than the exciting light; law of Stokes). However, since both the absorption and fluorescence spectra have both a nearly Gaussian shape, and may partially overlap, there is a limited interval of wavelength in which the emitted light may have shorter wavelength than the exciting light (so called anti-Stokes region of the fluorescence spectrum).
ATOMIC ABSORPTION (AND EMISSION) FLAME SPECTROSCOPY. If a sample (be it of biological origin or not) is heated on a hot flame, the chemical compounds it contains may be disrupted to isolated atoms (in gaseous phase). The absorption (or emission) spectrum of the gas thus obtained may be analyzed to reveal the lines characteristic of the quantum levels of isolated atoms. This method is occasionally used in medical toxicology (e.g. to reveal arsenic). In principle any monoatomic ion could be measured using this technique, but this is rarely done since electrochemical methods are equally selective and sensitive and much cheaper.
CHROMATOGRAPHIC METHODS. Chromatography is a technique in which a liquid or gaseous solvent (the mobile phase) moves over a solid, gel or liquid phase (called the stationary phase). If a mixture of different solutes is applied to the stationary phase and then eluted with the mobile phase, each solute undergoes a partition equilibrium between the two phases according to its relative solubility. The more a solute is soluble in the mobile phase the earlier it is removed from the stationary phase and eluted. The mobile phase that leaves the stationary phase is continuously monitored for the presence and concentration of solute(s), usually by means of spectroscopic methods.

Liquid chromatography is usually carried out using a highly solvated gel as the stationary phase, percolated with a liquid eluent (the mobile phase). The gel may have affinity for the substances to be separated because of their solubility (polarity chromatography), electrical charge (ion exchange chromatography), molecular mass (gel filtration chromatography) or specific binding (affinity chromatography). A short movie tutorial which presents the use of this technique to separate two substances (one brown, the other green-blue) can be downloaded from this link (29 MB - downloading can take time; codec Xvid required).
Gas chromatography is rarely used in clinical analyses. The stationary phase is an organic solvent, the mobile phase is an inert gas; obviously the substances to be analyzed must have a high vapour pressure. Gas chromatography is important for toxicology.
THEORETICAL BASES OF CHROMATOGRAPHIC SEPARATIONS. Chromatography is analogous to the partition of a solute between to non miscible solvents. Let us imagine that we have solution of two solutes named A and B in water. Prior to any attempt to separate A and B, let the concentration of A to be a1 and that of B to be b1. Suppose now that A and B are also soluble in chloroform, a solvent immiscible with water, and let the partition constants to be 4:1 for A and 1:4 for B. The definition of the partition constant is KA=[A]H2O / [A]CHCl3 = 4:1. Thus A is four times more soluble in water than in chloroform, while B is four times more soluble in chloroform than in water.
If we thoroughly shake our water solution with an equal volume of chloroform, allow the two solvents to separate and measure the concentrations of A and B in each solvent we obtain:
a2H2O = 0.4 a1
a2CHCl3 = 0.1 a1
b2H2O = 0.1 b1
b2CHCl3 = 0.4 b1
Notice that the total concentrations of each solute are half the inital one (i.e. a2H2O + a2CHCl3 = 0.5 a1) because the total volume is twice as the initial one.
The water phase presents an a2/b2 ratio of 4 (a remarkable increase with respect to the initial one a1/b1=1), whereas the opposite is true for the chloroform phase (a2/b2=0.25). If this enrichment of each solute in its preferred phase is not sufficient, the procedure can be repeated:
The water sample is estracted with an equal volume of chloroform; one obtains:
a3H2O = 0.16 a1
a3CHCl3 = 0.04 a1
b3H2O = 0.04 b1
b3CHCl3 = 0.01 b1
a3H2O + a3CHCl3 = 0.5 a2H2O
a3H2O / b3H2O = 16
The chloroform sample is extracted with an equal volume of water; one obtains:
a3H2O = 0.04 a1
a3CHCl3 = 0.01 a1
b3H2O = 0.04 b1
b3CHCl3 = 0.16 b1
b3CHCl3 + b3H2O = 0.5 b2CHCl3
a3CHCl3 / b3CHCl3 = 1:16
The procedure can be repeated as many times as needed to reach the desired degree of enrichment of A over B or B over A.
Since to reach partition equilibrium requires some time, and since in a chromatographic column the mobile phase moves over the stationary phase, equilibration occurs over a segment of the column, which is called the theoretical equivalent plate. A typical chromatographic column may contain some hundreds of plates and thus is equivalent to some hundreds of solvent extractions.
IMMUNOLOGICAL METHODS. Immunological methods are used to quantitate solutes with complex molecular structure, whose chemical analysis would be expensive and time consuming. These methods make use of antibodies specific for the substance of interest, and take advantage of their great specificity.
ENZYMATIC METHODS. The concentration of low molecular weight solutes that are substrates of enzymes can be selectively measured by adding the appropriate enzyme and monitoring the catalyzed reaction by absorbance or fluorescence spectroscopy (this implies that the reaction must produce a "signal"). An example of an enzymatic analysis is that of oxidation of glucose. The reactions are as follows:
glucose + ATP --> glucose-6-phosphate + ADP (enzyme: glucokinase or exokinase)
glucose-6-phosphate + NAPDP+ + H2O --> 6-phospho gluconic acid + NADPH + H+ (enzyme: glucose 6 phosphate dehydrogenase)
This assay is carried out by adding a small volume of the glucose containing sample to a spectrophotometric cuvette containing ATP, NADP+ and the two enzymes; the reaction is monitored by the absorbance change associated to reduction of NADP+.
Several pathological conditions may cause quantitative and/or qualitative changes in the protein content of body fluids, most notably blood plasma. Diagnosis of these conditions requires identification of the abnormal protein and measurement of its concentration. Qualitative changes include the presence of a protein in a fluid where it is normally absent, or presence of a patholgical genetic variant of a specific protein (e.g. hemoglobinopathies). Quantitative changes include absence or great diminution of the concentration of a protein that should be normally present in the fluid (e.g. thalassemias), or increase in the concentration of a protein (e.g. transaminases in the blood serum).
Increases in the concentration of a protein in a body fluid above their normal range may be due to overproduction (e.g. multiple myeloma) or to the death of cells that contain the protein, and consequent release in the blood (e.g. transaminases during acute hepatitis). Decreases in the concentration of a protein may be due to diminished biosynthesis, as in thalassemias or hemophylias, or accelerated destruction or loss (e.g. hypoalbuminemia in the course of nephrotic syndrome). Since multiple mechanisms may lead to similar conditions, differential diagnosis is never simple or based on a single finding and requires multiple laboratory and clinical investigations.
TOTAL PROTEIN CONTENT. Total protein content (concentration) is measured in the plasma, urine or cerebrospinal fluid. The normal values of total protein concentration in these fluids, together with examples of pathological conditions that cause significant changes in this parameter are reported in the table below:
| Blood plasma | Urine | Cerebro Spinal Fluid | |
| Physiological protein concentration | 7 g / dL | ||
| may be higher because of | multiple myeloma | nephrotic syndrome | bacterial meningitis |
| may be lower because of | nephrotic syndrome chronic liver disease extensive burns |
- | |
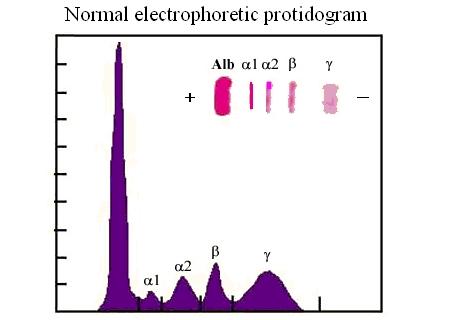
ELECTROPHORESIS AND THE ELECTROPHORETIC PROTIDOGRAM.
Electrophoresis is a method to separate charged macromolecules (e.g. proteins, DNA) by means of their rate of migration in a stationary electric field. Nucleic acids are negatively charged because of their phosphate groups; proteins can be positively or negatively charged, depending of the pH of the medium, because of their acidic (aspartate and glutamate) or basic aminoacid (lysine, arginine) residues. A photographic tutorial which describes the technique can be looked at this link.
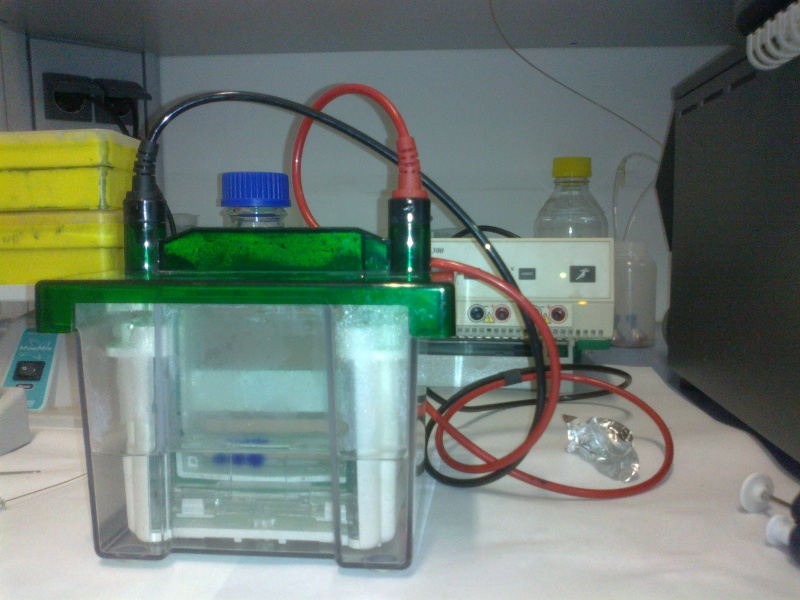
In a typical experiment the protein mixture to be subjected to the analysis, dissolved in a buffer at the desired pH is applied to a gel matrix (in the figure above a gel of polyacrylamide) equilibrated in the same buffer. Current is applied via the electrodes at the top (negative electrode in the figure above) and at the bottom of the gel (positive electrode in the figure above) and the proteins migrate with a velocity that is proportional to their net negative charge and inversely proportional to their molecular mass. A tracking dye (bromophenol blue, evident as a series of spots in the picture above) is added, that migrates faster than any protein in the mixture because of its very low molecular mass, in order to indicate the migration front, and the run is stopped when the dye has reached the bottom of the gel. The proteins trapped in the gel are then stained with a suitable dye and their concentration is quantitated by means of absorbance or reflectance spectroscopy (see the figure below).
Molecular biology is mainly concerned with the study of genetic material. The key method for the study of gene variants is their selective amplification using the DNA Polymerase Chain Reaction (PCR) followed by sequencing. The main clinical indication for this type of analysis is the diagnosis of inherited genetic defects, e.g. hemoglobinopathies, thalassemias, cistic fibrosis, favism, phenylketonuria and the like. The analysis requires a bloof sample to prepare DNA (from the leukocytes), and can be carried out on the patient and on his/her parents; in prenatal genetic conseling on the parents only.
The polymerase chain reaction requires that RNA primers specific for the gene of interest be added to the patient's DNA, together with a heat-resistant DNA polymerase (e.g. from the thermophylic bacterium Thermococcus thermophylus). The sample is heated to separate the DNA double strand, then cooled to allow the primers to couple with the desired genetic region, and the polymerase to synthesize new DNA; then the process can be repeated as many times as necessary. At the end of the procedure the DNA fragment identified by the artificial primers provided by the researcher will be amplified by hundreds- or thousands-folds.
Home of this course